Median Prices
House and unit medians mapped across every covered area — the spread visible on the map, not buried in a table.
They spend weeks narrowing the map before showing you a single property. That's the part that decides whether it works out — and it's the part you've been doing with thirty browser tabs. One platform, without the $18,000 fee.

House and unit medians mapped across every covered area — the spread visible on the map, not buried in a table.

Gross rental yield, mapped. See which areas pay their way and which do not, at a glance.

Where prices have actually moved over five years, and where they have quietly gone nowhere.

Population today and projected, who owns versus rents, gross regional product and the industries the region rests on.

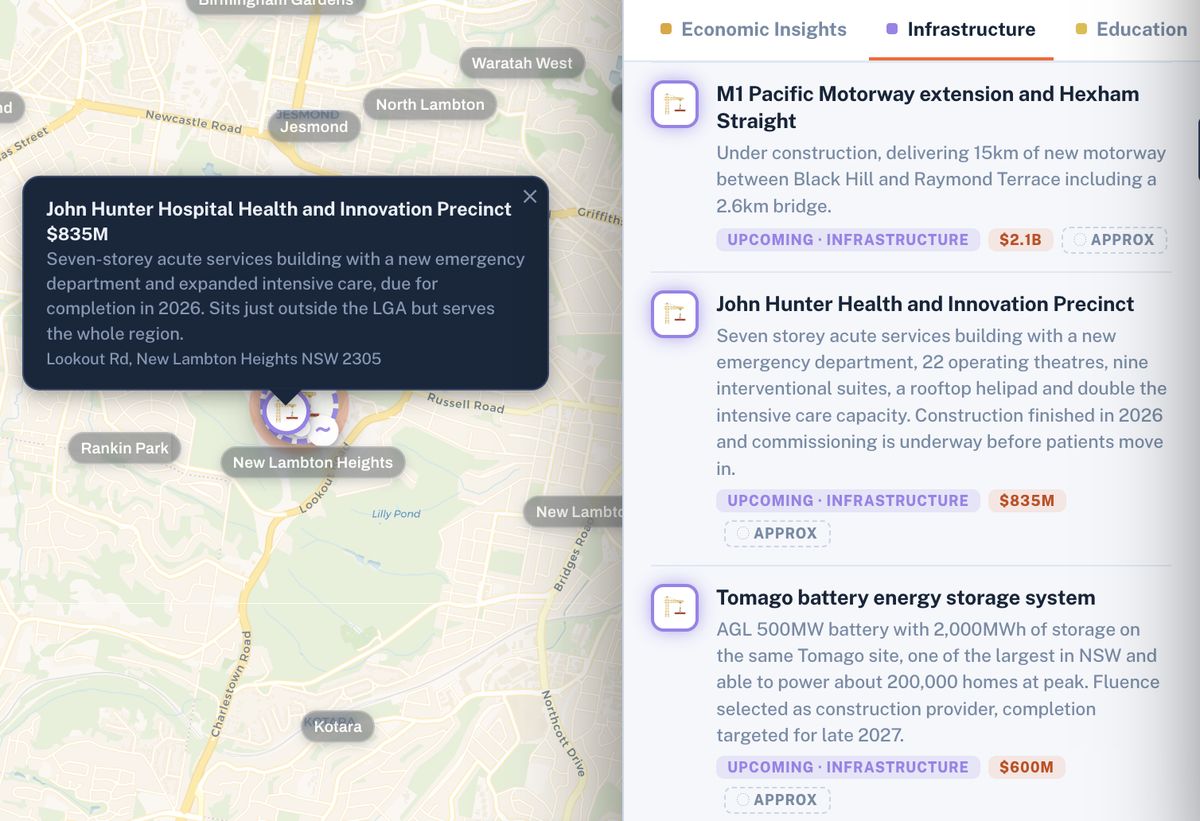
Built, under way and proposed — with the stage, the value and who is behind each project.

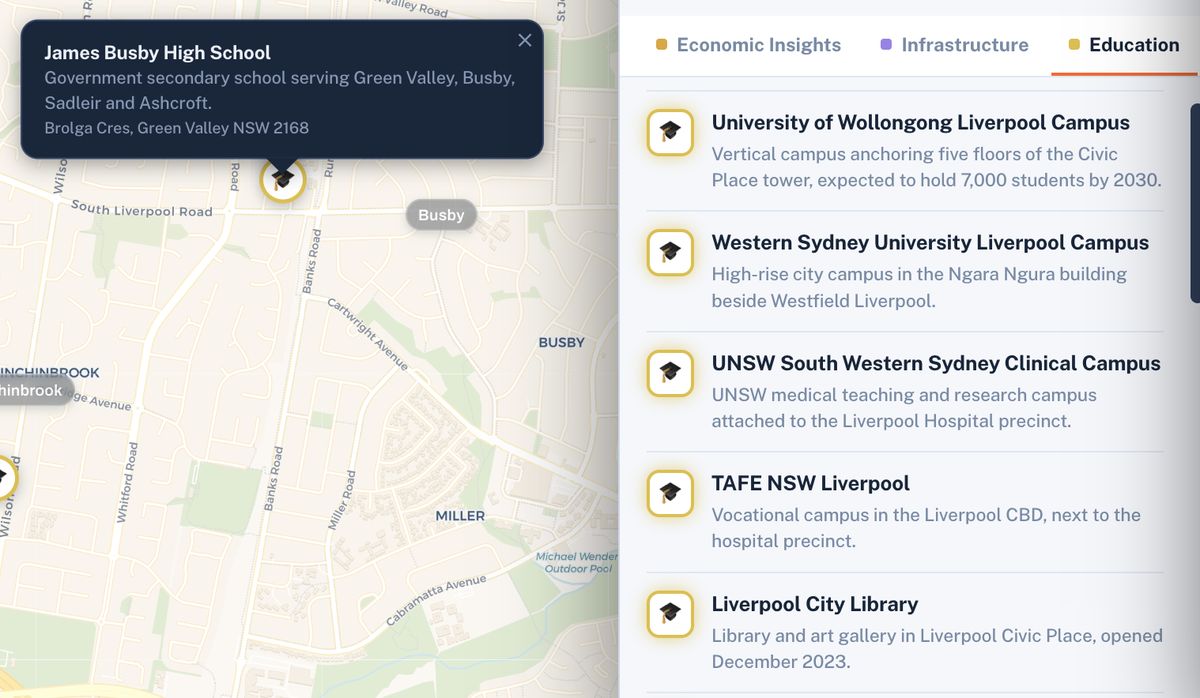
Primary, secondary, vocational and tertiary — including the campuses that pull people into an area.

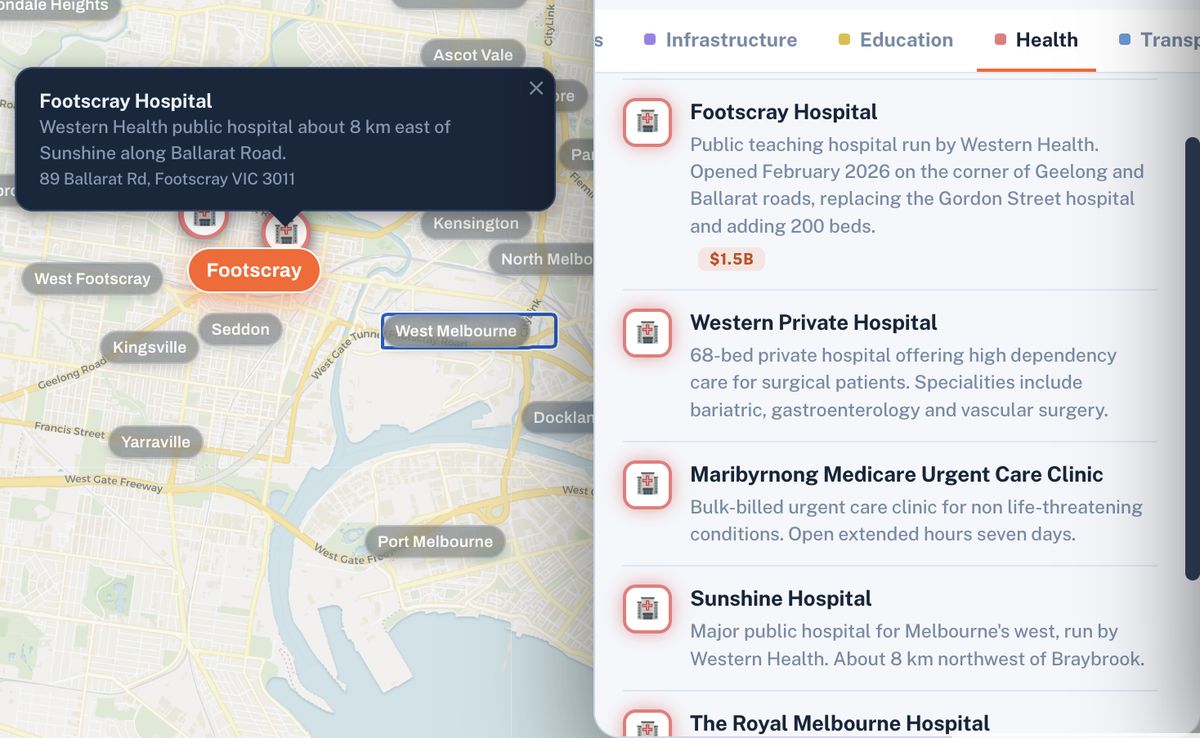
Hospitals, private facilities and urgent care — the ones people actually move for.

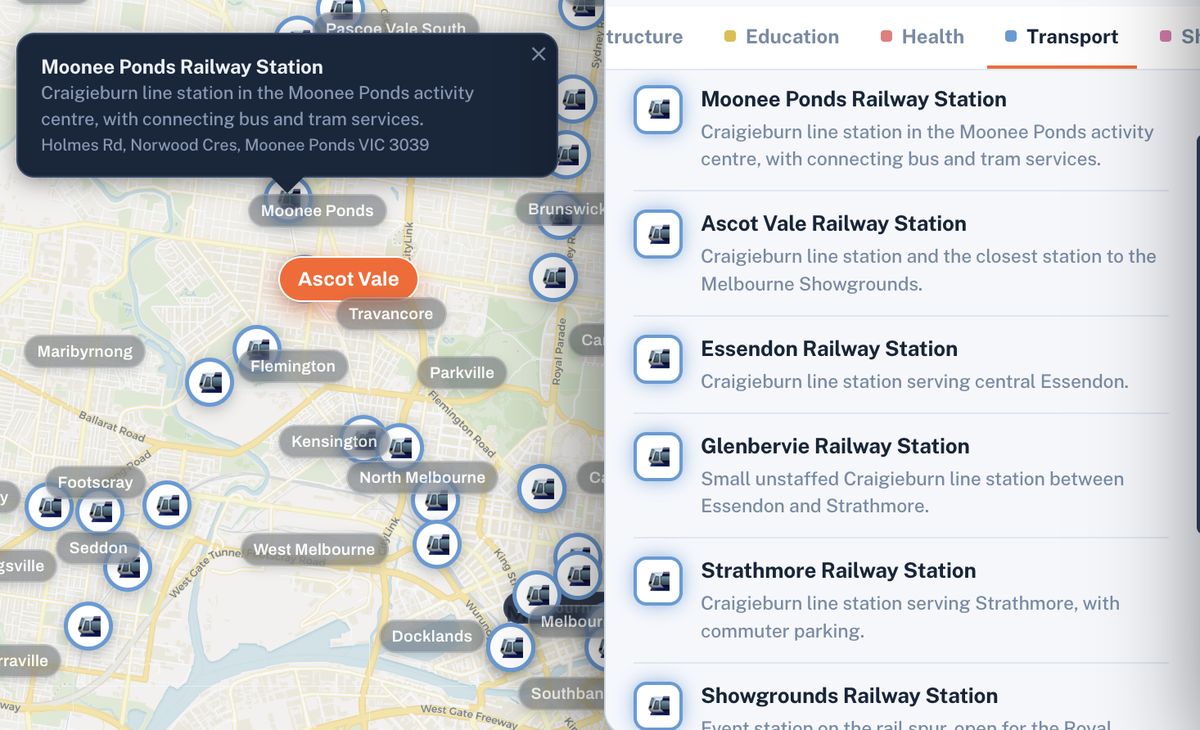
Rail, light rail and interchanges, with the lines and connections that make a commute work.

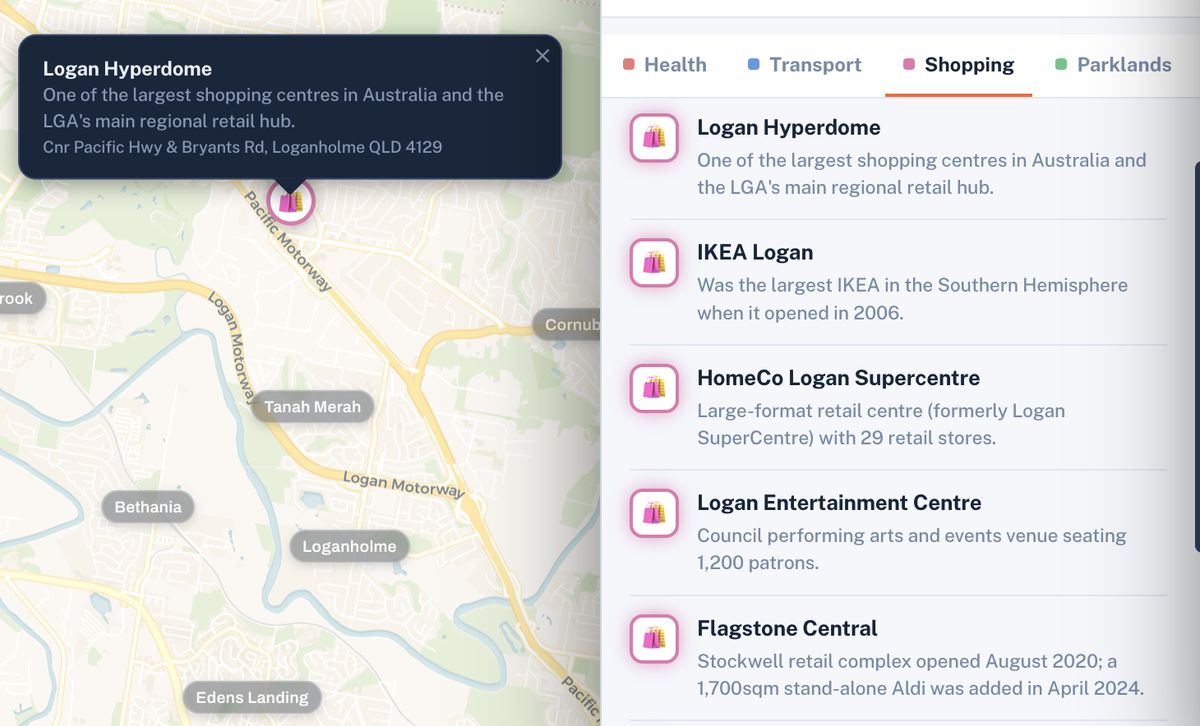
Regional hubs, large-format centres and local strips, sized by what they actually hold.

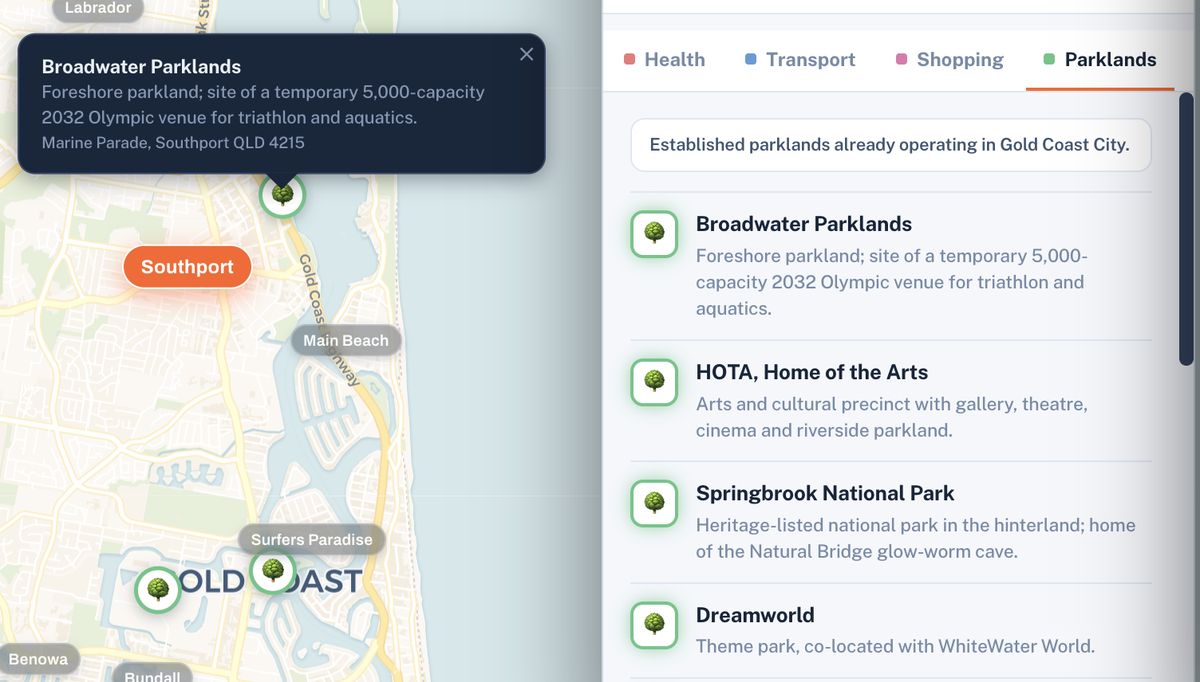
Foreshore, national parks and recreation precincts within reach of the area.
Not "here's some data" — a set of tools built to eliminate. Filter, compare, pin and report until only the areas that fit your numbers are left standing.
Search any suburb and the map builds around it, each point carrying its own detail and its distance from where you're looking.
Each layer sits over the same ground, so you are never comparing one area's schools against another area's hospitals. Toggle them on and off as you narrow.
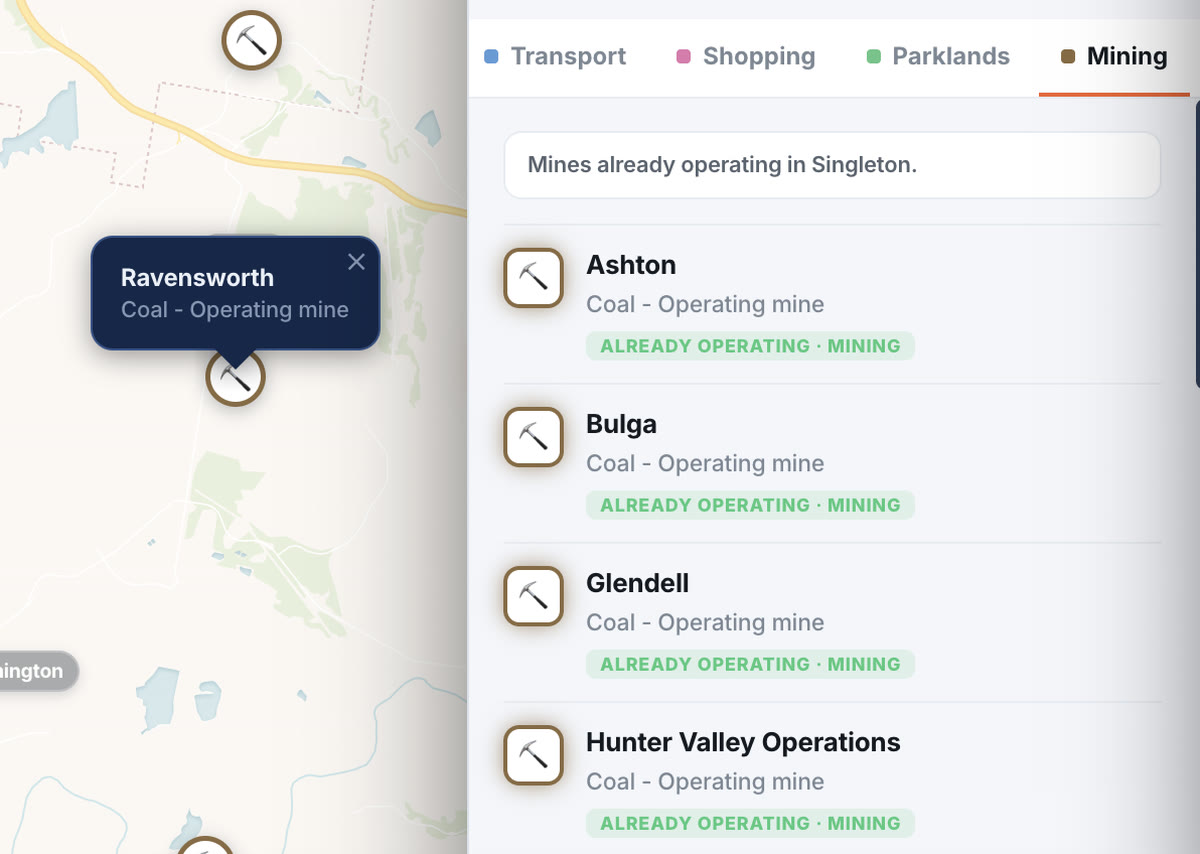
Motorway extensions, hospital precincts and energy projects — with stage and value. Schools, TAFE and university campuses, including the ones that pull people in. Public and private hospitals, urgent care and the facilities people move for. Stations, lines and interchanges — the connections that make a commute work. Regional hubs, large-format centres and the local strips in between. Foreshore, national parks and recreation precincts within reach.
Click one area, then another. The differences line up on the same rows, so they're obvious rather than arguable.
Not "show me houses" — "show me where to look". The search a listings portal can't run.
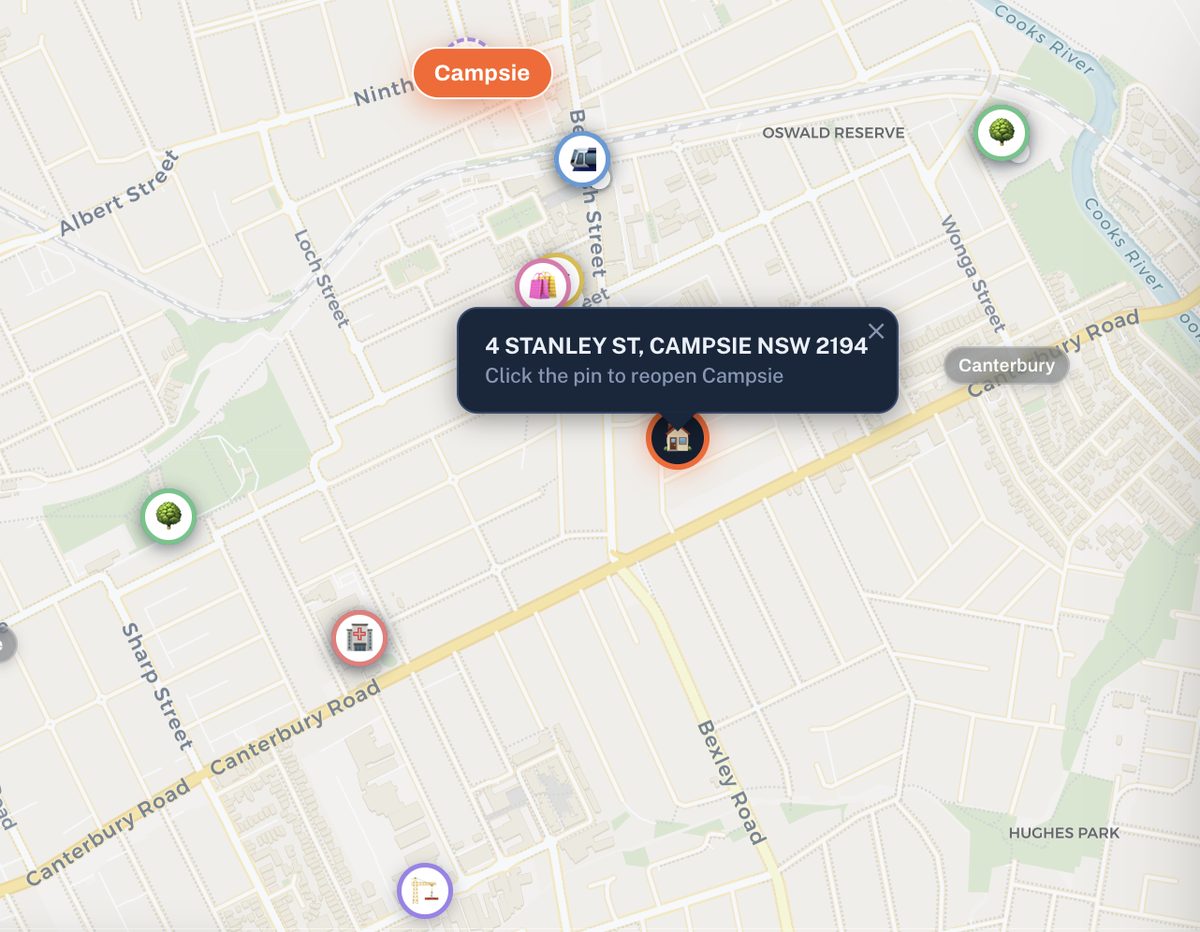
Two houses in the same suburb can have completely different surroundings. The pin shows you which one you're buying.
A structured document, not a screenshot dump — with a plain-English note on how to read it and what it isn't.
This is the platform's own data — real medians, yields, five-year growth and sales volumes across five regions. Move the sliders and watch them narrow to a shortlist. Which areas came back is what you're buying.
Drag the sliders to filter these. The full platform covers 1,900+ areas nationally, and every match opens into its complete layer set and report.
Population, demographics and regional economics come from the Australian Bureau of Statistics and profile.id. Infrastructure, transport, education, health and retail are compiled from state and local government project registers and operator records. Every figure is dated at the point it was loaded.
Not features — the six things that go wrong when the area work never gets done properly.
Settle the area before you look at a single listing. When the suburb is already justified, the house is the easy part.
Screen dozens of areas in an evening instead of three across a month. When the right one appears, you already know whether the area stacks up.
Every area produces a dated, sourced report you can put in front of a partner, a broker or an accountant — and defend.
Scan on your numbers and areas surface by the data instead of by reputation. Most people find something they had never typed into a search bar.
A large share of that fee is area research done before you are shown anything. This is that work, at a fraction of the cost, done by you.
Nine layers on one screen, measured the same way for every area, so comparisons are obvious rather than arguable.
No subscription, no auto-renew, no card kept on file. These are Version 1 prices — they go up when Version 2 ships.
For buyers agencies, brokerages, accounting firms and developers who need Brixel across a team — or under their own brand. Tell us what you need and we'll come back with a price.
[Insert refund window and conditions verbatim from your Terms & Client Terms. Page and legals must match word for word.]
Brixel is a mapping platform and needs the screen space. Buy on any device — your access link is emailed straight away — then open it on a laptop.
No. You buy a block of access — 30 days, 3 months or 12 months — as a single payment. Nothing auto-renews, no card is kept on file, and when the period ends it simply ends.
No, deliberately. Brixel shows you the data and the map; interpretation and the decision stay with you. Nothing in the platform or in any report is financial, investment, legal or tax advice.
If you want a person involved, the platform can connect you with independent professionals. That's your choice, not a step you're pushed through.
Just under 2,000 Australian areas are live today, and the dataset grows every week. We deliberately don't claim national coverage, because it wouldn't be true yet.
If you search an area we haven't built, the platform says so plainly and lets you register interest. Anything added while your access is active is included at no extra cost.
[List your real sources — ABS, state planning portals, council DA trackers, transport authorities, market data providers.]
Every figure carries the date it was loaded. Figures are indicative and point-in-time — confirm anything you'll act on independently.
Portals answer "what's for sale right now". Brixel answers "where should I be looking in the first place". It's the step before the portal, not a replacement — you'll still go to the listings, you'll just arrive knowing why you chose that area.
You might, and for some people that's right. But the fee typically runs $8,000–$20,000, and a large share of it covers area research done before you're shown anything. If you'd rather do that part yourself, this is that work without the fee.
Some people use both: narrow the map here, then bring a shortlist to a professional instead of a blank page.
It's built for desktop. The map, layers, comparison view and reports all need screen space, and we'd rather say that up front. Buy on any device — your access link is emailed instantly — then open it on a computer.
[State the real timeframe. If access is automatic, say "immediately after payment". If you set accounts up by hand, say so and give an honest window.]
[Insert refund and cancellation terms verbatim from your Terms & Client Terms.]
You were going to spend the next four hours researching anyway. Spend them one level up.
One-off payment · Version 1 pricing · Built for desktop